 |
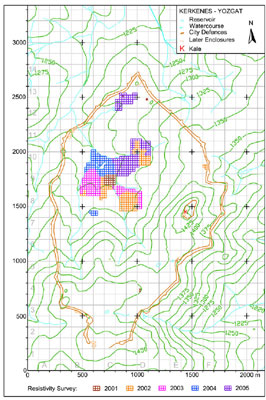
Figure1. Resistivity survey progress map, May 2005. |
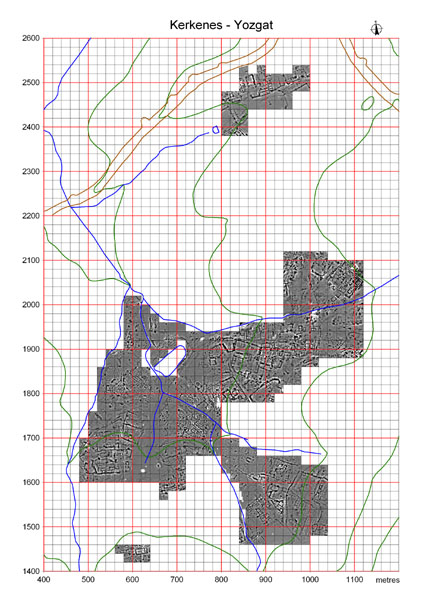 |
Figure 2. Combined image of the main areas of resistivity survey, 2001-2005. |
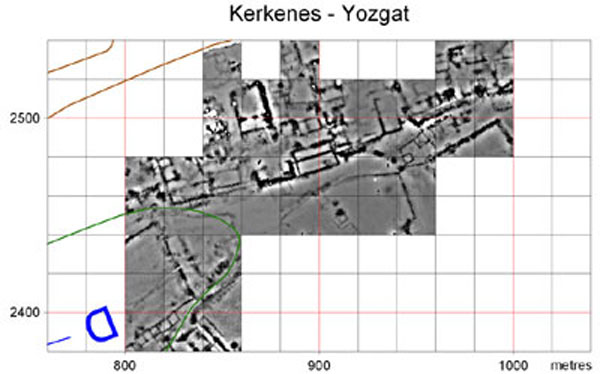 |
Figure 3. 2005 resistivity survey in the northern sector of the city. |
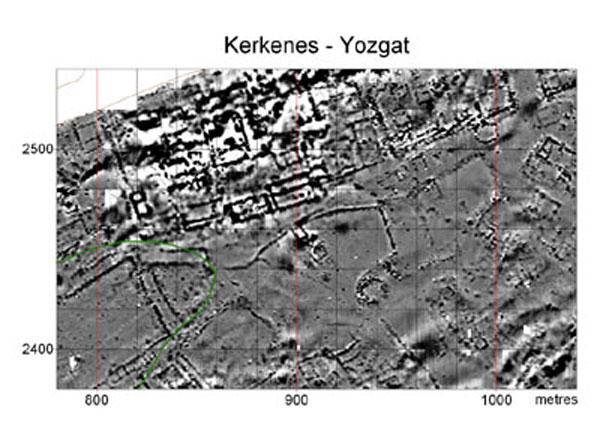 |
Figure 4. Fluxgate gradiometer survey of the area shown in figure 3, from previous seasons. |
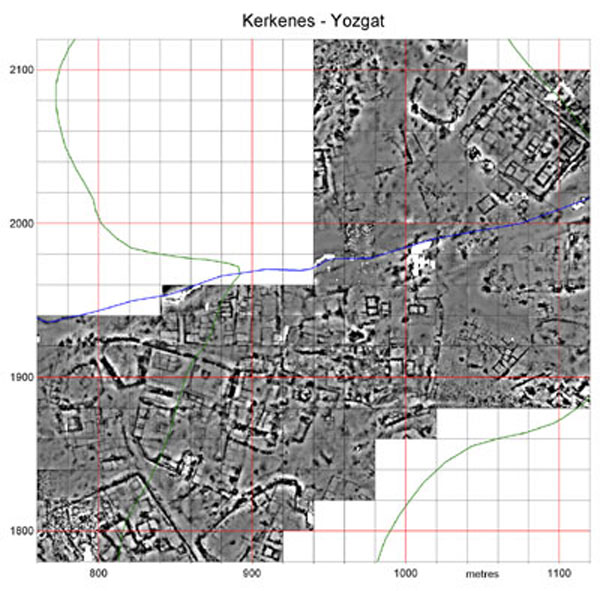 |
Figure 5. A portion of the resistivity survey of the central area, 2002 and 2005. |
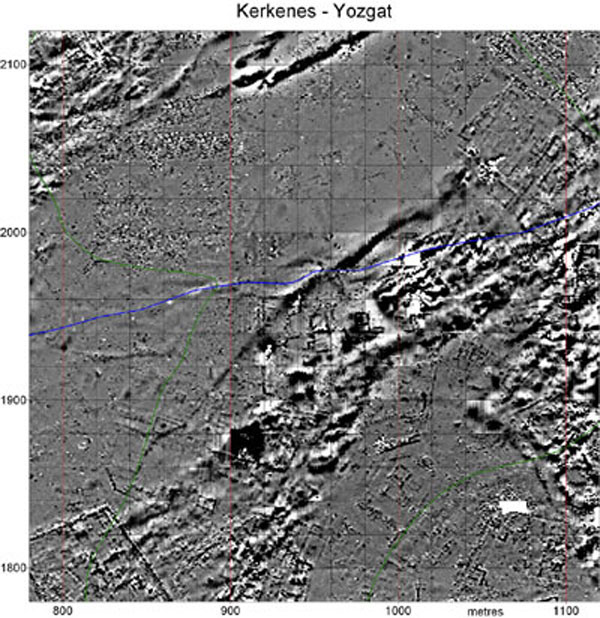 |
Figure 6. Fluxgate gradiometer survey of the area in figure 5, from previous seasons. |
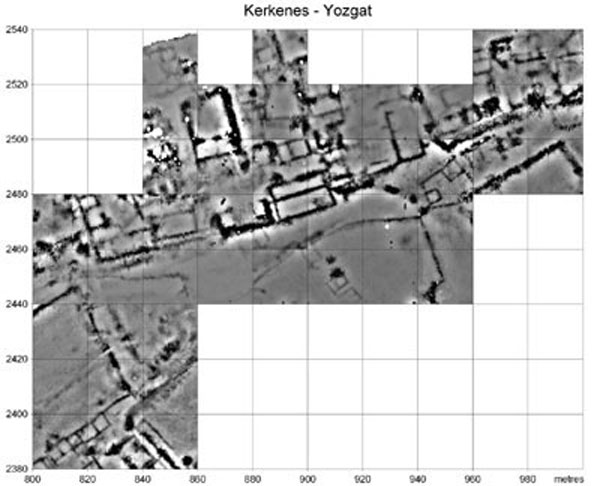 |
Figure 7. 2005 resistivity survey in the northern sector of the city showing the large hall and associated buildings that in 1996 were investigated by Test Trench 15. |
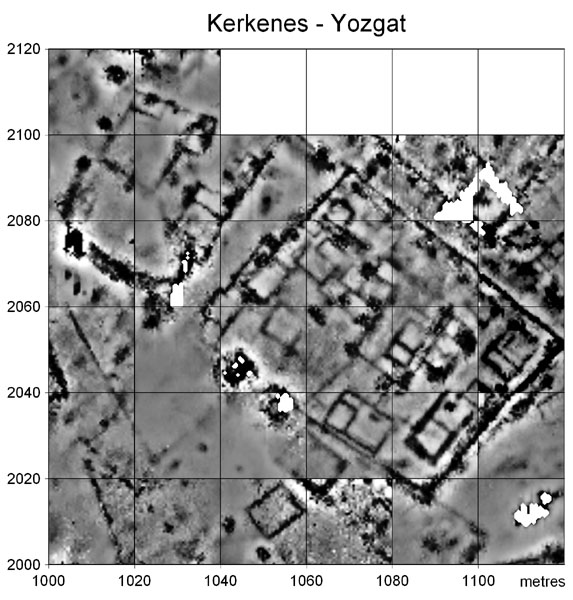 |
Figure 8. 2005 resistivity survey of a prominent urban block and its environs seen at upper right in figure 5. |
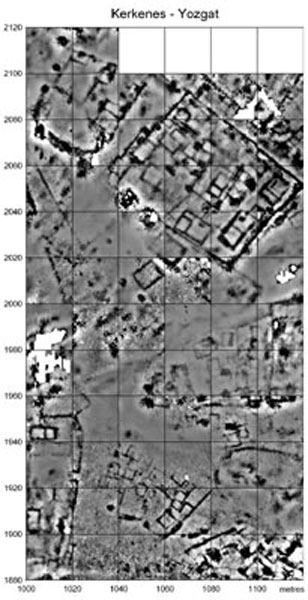 |
Figure 9. 2005 resistivity survey in the central sector seen at right on figure 5. |
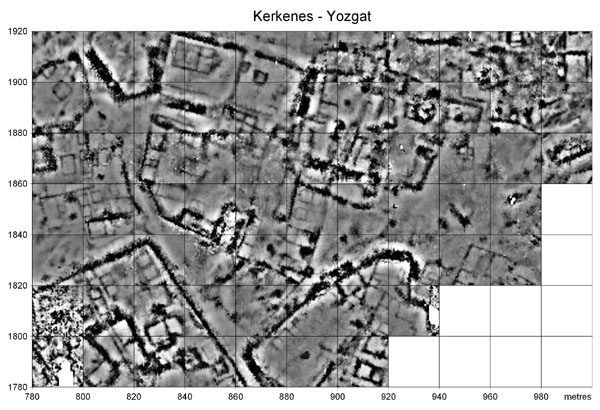 |
Figure 10. Resistivity survey in the central sector seen at left on figure 5. |
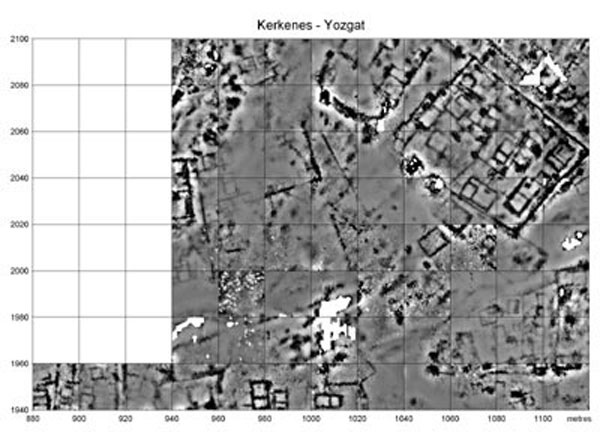 |
Figure 11.Resistivity survey in the central sector seen at top on figure 5. |
Last updated