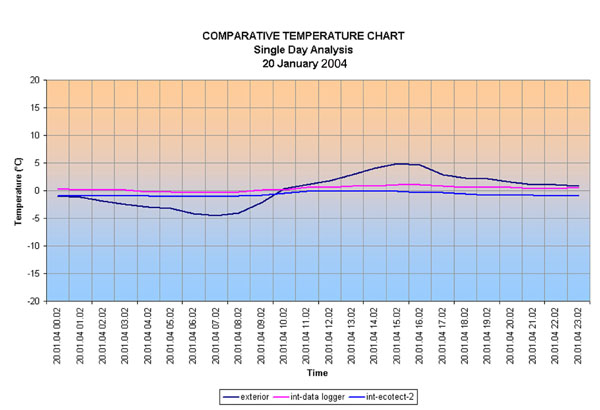
The hourly temperature profile for a single day analysis (20 January 2004) recorded by a datalogger placed inside the building (pink line) can be compared with the profile obtained from a computer simulation (blue line) performed in Ecotect v.5.20. The exterior air temperature recorded (dark blue line) is shown on the same graph.
![]()