RESULTS: Geographical Information Systems
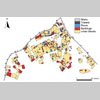
Figure 27 |
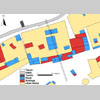
Figure 28 |
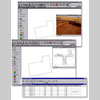
Figure 29 |
The aims of this facet
of the Kerkenes Project are:
1. Construction
of a database containing the graphic information that has been obtained
over the northern end of the city and other selected areas.
2. The linking
of graphic data to different data sets in tabular form.
3. The linking
of graphic data to textual and pictorial data sets.
The Kerkenes Project
has, since its inauguration in 1993, gathered huge amounts of data
in different forms. GIS appears to provide the best possible platform
on which these widely variant types of data set can be integrated,
thereby allowing for the implementation hierarchically ordered levels
of analysis. The advantages of selecting GIS as the platform are
twofold:
1. By far the
largest data sets are graphic, e.g. aerial (balloon) photography,
survey grids and nets for spatial referencing, measured maps and
plans, Global Positioning System (GPS) 3 dimensional data, geophysical
data of sub-surface features (very largely buildings), detailed
structural plans from limited excavation. Other data sets will be
constructed in the future, including geological, geomorphological,
soil cover, vegetation cover and microclimatic.
2. The nature
of the data is, and will continue to be, very largely spatial. The
types of analyses that we wish to apply to the data sets are to
do with concepts that come from urban geography, city planning and
cultural interactions with spaces.
Database Construction
for GIS
Features are added to the database through digitising from a variety
of imagery. Geomagnetic images provide the most detailed evidence
available over large areas. The interpretation of the geomagnetic
data has, in a few instances, been proven to be correct by precise
experimentation in the form of excavated test trenches. (This is
of particular importance with respect to roofed and unroofed spaces
and the recognition of stone paved external areas).
Currently there are
three levels or layers within the GIS database, (Figs 27,
28, 29)
to which more will be added once an assessment of this first experimentation
has been completed.
Level 1 large
enclosed spaces (termed urban blocks)
Level 2 roofed
structures (buildings)
Level 3 small
roof units (rooms)
Tabulated data, in the
form of attributes, cover a huge variety of subjects, spatial, material
(stone, mud-brick etc), relational (e.g. position of doorways).
Linked data can include other sections of the existing database,
such as photographs, geophysical imagery, description in text form,
slope and aspect maps.
Urban Blocks
· Graphical: Over the northern end of the city the
large walled spaces, termed urban blocks, have been digitised from
the geophysical data, and additional information has been added
from measured maps (made by total station survey) and balloon photography.
· Tabulated: Tables of data in tabulated form have
been added to each block. The attributes that have been included
at this early stage represent an experimental selection, and do
not embrace the full range of attribute categories. Further, The
availability of data for each of the selected attributes varies
from block to block, primarily because the clarity of information
that can be derived from geomagnetic survey varies from place to
place. This variation in the clarity of geophysical data occurs
for a variety of reasons that range from the quality of data collection,
the intensity of burning in the destruction of the city, underlying
geology and the depth of overburden.
· Assessment: The data appears to be good and reliable
and it should now be possible to make the first analytical trials
using GIS.
Buildings or Structures
· Graphical: Within each urban block an attempt has
been made to identify and digitise individual buildings and structures.
This is not as straightforward as might be expected because it becomes
necessary to introduce levels of interpretation. It is only as the
process of database construction progresses that the levels of interpretation
required become clear. It will perhaps become necessary, or at least
prove to be useful, to rank different levels of interpretation according
to some scale of confidence: a stage that has not yet been reached.
Indeed, there appear to be different classes of interpretation,
some of which are more difficult to evaluate than others.
· Tabulated: Each structure or building has a set
of attributes in tabulated form. In the majority of instances, such
as two-roomed structures and rows of small rooms, there ought not
to be any obvious difficulties (provided that the geomagnetic image
is clear). Some larger complexes pose questions of what to include
and what to exclude from a "structure". It is not possible,
except in the rarest of instances, to reconstruct the order in which
structures were erected; thus there is no time dimension that requires
incorporation into this section of the database.
· Assessment: The first experimentation has made clear
that the identification of structures and buildings, and the determination
(for the purposes under consideration here) of such attributes as
walled spaces, roofed areas and external stone pavements requires
the initial input of architect and/or archaeologist together with,
on occasions, a geophysicist.
Rooms or Roofed
Units, and Internal Open Spaces or Courtyards
· Graphical: Buildings or structures generally comprise
more than one unit. Individual units are usually in the form of
rooms, but we do have some evidence from open units, such as courtyards
and storage areas, that are integral parts of buildings.
· Tabulated: Tables of data in tabulated form are
added to each room. As with the buildings, the attributes that have
been included at this early stage represent an experimental selection,
and do not embrace the full range of attribute categories.
· Assessment: Where four walls can be seen the identification
of rooms raises less doubt than the recognition of the parameters
for multi-roomed structures. It might be worthwhile to begin by
defining rooms, and then proceeding to buildings.