| |
| |
|
|
|
| Fig
1 |
Fig
4 |
Fig
5 |
Fig
6 |
| |
|
|
|
| Fig
7 |
Fig
8 |
Fig
9 |
Fig
10 |
| |
|
|
|
|
| |
Fig
11 |
Fig
12 |
Fig
13 |
|
|
|
|
|
|
|
|
|
Urban Survey
Introduction
The 2001 field season took place in three parts: a short spring
season devoted to resistivity survey at a time when the ground retained
sufficient moisture, a six week summer season that combined geophysical
survey with the study of materials from previous excavations and a period
of additional geomagnetic survey and pottery restoration in September.
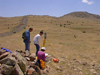
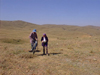
New initiatives in 2001 included the geophysical experiments carried
out by Harald von der Osten-Woldenburg (Fig. 1),
the great nephew of Hans Henning von der Osten who was responsible,
together with F. H. Blackburn, for the creation of the first map of
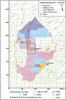
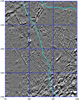
the city's walled limits in 1927. The progress map (Fig. 4)
shows the areas already covered by the geophysical survey.
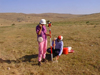
Figure
5 shows the Total Station used to set out the 20m grid for the
geophysical survey, the view looks south-east with the north-eastern
stretch of city wall at left and the Kale at right.
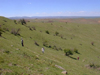
Wooden pegs are hammered into the ground every 20m (Fig.6).
Each peg is marked with white lime so that its position is not lost
between seasons if shepherds burn the pegs to make tea. Communication
between the station and the roving prism is by means of a walkie-talkie.
Teams of men from the village (Fig. 7)
are sufficiently practised to conduct gradiometer survey on the steepest
of slopes without loss in the quality of data collection.
Remote Sensing
Harald von der Osten-Woldenburg kept the Kerkenes Project at the leading
edge of experimentation and application of geophysical methods in archaeology
through extensive trials with electromagnetic induction techniques using
a Geonics EM 38 instrument (Fig. 1).
The existing Kerkenes geomagnetic images are of such quality that they
can be readily used as a control for this new method. Initial results
are most encouraging, but the instrument can only be used where the
terrain allows rapid movement at a constant speed, sometimes running
backwards, without tripping or banging the instrument. Although the
initial results (Figs. 9b
and 10a)
do not provide the same degree of clarity that is to be seen in the
geomagnetic and resistivity imagery, (Figs 9a,
10b and
10c) they
are impressive for a first try. Design of an instrument geared more
towards the needs of rapid survey with high density sampling strategies,
as required by archaeology, combined with ongoing refinements to the
software are likely to make this a method that will have wide applications
in the future.
Geomagnetic survey of the entire city at Kerkenes, using Geoscan fluxgate
gradiometers, is now only one single season away from completion (Fig.
4).
When finished the magnetometers will have been carried over more than
two square kilometres of the site for something in the region of 36,000,000
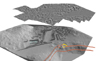
paces. Combination of two-dimensional magnetic imagery with the three-dimensional
Global Positioning System (GPS) survey that was successfully concluded
in 2000, now allows the application of sophisticated computer programs
to create simulations and perform analysis of the urban environment
(Fig. 12).
Virtual reality is just around the corner. ArcView is becoming the central
platform for the Project and the July issue ArcNews contains a piece
that brings aspects of the Kerkenes research design to a GIS audience.
A short spring season and experiments in the early days of the summer
program, before the Kerkenes soils became baked so hard that probes
made of the hardest available steel became bent within minutes, proved
that electrical resistivity survey (Fig. 8)
in carefully selected areas that are more or less free of stone rubble
can produce excellent results (Fig. 10c).
In some instances the resistance images reveal some structures with
greater clarity than the magnetics. This seems to be particularly true
of areas where there is greater overburden.
Figure 9
shows a 40 x 40m block at the northern end of the city surveyed using
different geophysical methods. By July, however, the ground had become
too hard for the insertion of steel probes for electrical resistivity
survey. Both the gradiometer (a) and the electromagnetic induction (b)
survey show a large hall and anteroom at left and a row of four cells
at right. The gradiometer shows a pair of posts on either side of the
central door between the hall and the anteroom, but neither method was
able to detect the bases for wooden columns that would have been required
to support a roof.
Figure 10
illustrates three geophysical survey methods each produce imagery that
brings out different features. The location of this one hectare (100
x 100m) survey area is given on Figure
4. Electromagnetic induction (Fig. 10a),
used with a high density sampling strategy for the first time at Kerkenes,
reveals most of the features seen in the other two images. As a result
of this experiment improvements are now being made to the machinery
at the same time as the processing software is being developed. Geomagnetic
survey with a fluxgate gradiometer (Fig. 10b)
reveals many of the buildings in very considerable detail. In some instances
the position of burnt door posts can be seen (e.g. grid 740/1720 not
seen in Fig. 10c).
The imagery is influenced by different degrees of burning and by the
magnetic properties of various building materials in ways that are not
yet fully understood. The underlying geology and geomorphology also
has effects, particularly where bedrock is close to the ground surface.
Processing the same data with different parameters does, however, bring
out considerably more detail than it is possible to show on a single
image. Electrical resistivity survey (Fig. 10c)
highlights details with remarkable clarity where there is a favourable
combination of conditions. Unlike with gradiometer imagery, heat induced
alterations to magnetic properties have no effect, although fire alteration
to mud-brick and other materials is significant. The background is strongly
influenced by hydrology, a stream bed accounting for the broad sweep
of white. The two parallel white lines that run diagonally across the
picture indicate the path of a tractor track.
Figure 11
showing the results of the gradiometer survey over a twelve hectare
(300 x 400m) area at the centre of the city (Figure 4
gives the location), provides an overview and details of subsurface
remains at the same time. This particular image combines data from 2001
with results from earlier seasons at a single level of data processing
Aspects of the Urban Infrastructure
Space only permits brief mention and selective illustration of some
of the more significant developments. A single twelve hectare (300 x
400m) image (Fig. 11)
of sub-surface remains within the central portion of the city may serve
as an example of the results that can be replicated over the greater
part of the very large area that has been surveyed (Fig. 4).
Urban blocks and streets were laid out according to a conceptual scheme
that was sufficiently flexible to allow for distortion to rectilinear
planning where topography made such deviation expedient. Areas that
were not enclosed within urban blocks in the initial scheme of things
were, if our interpretation of the horizontal stratigraphy is correct,
gradually filled by more random building construction. In Figure 11
the large block to the left of centre, revealed in 1995, can now be
seen in its wider urban environment. At centre right a less regular
block can be seen, the south-west corner of which is defined by the
meandering street that clings to the contour. This same block contains
a variety of buildings which at first sight appear to be recorded with
exceptional clarity, but which pose particular problems of interpretation.
The block would appear to be dominated by a large rectangular space,
the south-eastern third of which is divided from the larger section
by a pair of strong signals. It is very possible that this feature is
yet another of the large columned halls that are a particular architectural
characteristic of the city, and that the two high spots were created
when the wooden posts of double doors were burnt (a phenomena seen elsewhere
at Kerkenes). Resistivity survey might reveal stone column bases which
would verify this interpretation. Above the north-west corner of this
putative hall are two parallel rows of rectangular rooms, each some
6 x 4m, with a corridor between. The less distinct structure to the
left may be of similar form. It is somewhat exceptional to find such
a large number of cells, which were presumably for storage, within a
single complex. Single rows of similar cells are not, however uncommon;
one row being visible at the centre of the image and another in the
block left of centre. Also clearly identifiable are a number of the
more usual two-roomed buildings one of which, in the block on the left,
was partially excavated in 1996.
Another new development of particular significance has been the recognition
of two buildings that appear as though they might be megarons (Fig.
10, especially
bottom left of 10c). A megaron is a type of building, characterised
by a pitched roof, open porch and central hearth, that has clear cultural
connections with Phrygia in western Anatolia. The two structures seen
on Figure 10, both of which lie in areas that were apparently outside
any of the original urban blocks, are substantial buildings each measuring
approximately 10 by 12m. The existence of these megarons may perhaps
represent further evidence for degrees of Anatolianisation during the
development and growth of the city, but before its destruction around
547BC.
Within yet another area of the central portion of the city, not illustrated
here for want of space, magnetic survey has led to the identification
of a large open area that was clearly a public place. One possible function
for this feature could very well have been as a market place for which
no other good candidate exists within the city walls. Situated to the
north-east of the B³y³k G÷l (Big Pond), the largest of the artificial
reservoirs within the city, this large level area occupies a sheltered
position in the central sector of the site. Several of the major streets
run tangentially to this space which must have been devoid of buildings
for some special purpose. New imagery of the B³y³k G÷l itself, obtained
when it was completely dry in September, has revealed the presence of
substantial stone walls within the artificial banks on all four sides.
Unlike the S³l³kl³ G÷l (Leech Pond) on the high southern ridge, also
fully surveyed when completely dry, the B³y³k G÷l does not seem to have
an elaborate and carefully constructed stone lining. Although part of
an overall, planned, scheme of urban water management, the various pools
and reservoirs within the city evidently varied in status and had differing
functions.
Geomagnetic images of the steep central slopes between the high southern
ridge and the lower area of the city, also obtained in 2001 but omitted
here, have delineated the two connecting streets, that to the east turning
sharply round the head of a small stream so as to maintain a vehicular
gradient, together with crescents of small blocks following the contours
above. The extreme north facing slopes above the head of the western
stream are, not surprisingly, devoid of structures. This expanse, the
only large empty area within the entire city, difficult to negotiate,
exposed to icy winds and far distant from the nearest gate, would have
afforded the least desirable urban real estate.
Away from the site, analysis of the urban dynamics of the site using
Geographical Information Systems (GIS) continues in the capable hands
of Nahide Aydin, who recently completed the Masters Program in Archaeometry
at METU. Scott Branting is also proposing to write a doctoral thesis
on transportation and GIS at Kerkenes at the University of Buffalo.
|
|