Kerkenes Home Up << Page 4 >> Index


Geophysical Survey in 1993:
In 1993 we snatched at the opportunity to bring Lewis Somers of Geoscan to Kerkenes. Trials with gradiometer and resisitivity survey methods clearly indicated that further remote sensing survey at Kerkenes would be very rewarding. The first geophysical images could, however, only be obtained at a scale 1:444, the number of dots per inch on the printer!


The Magnetometer:
A Geoscan FM36 fluxgate magnetometer measures subsurface disturbances to the earth's magnetic field. Data is collected in 20 x 20m grids at a sample density of 4 readings per metre at 1m traverse intervals. A higher sample density does not yield better images. Data is processed in Geoplot but can also be used with other software including those of GIS.


A Geomagnetic Map:

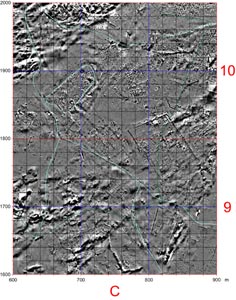
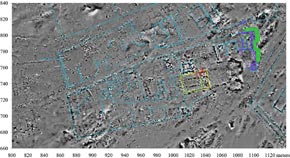
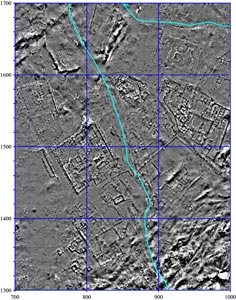
A sample of the geomagnetic map illustrated here shows features in the first 1.0 to 1.50m below the surface. Walls and buildings can be clearly seen, sometimes in remarkable detail, as can some of the geology and geomorphology. Watercourses have been superimposed in light blue. The blue grid squares are 100 x 100m. Each square contains 25 grids of 20 x 20m. An average of 30 grids of data can be collected in a long (10 hour) working day if the terrain is not too hostile. On occasions 40 grids were collected. We have not yet calculated how many readings have been collected over the 2.5km2. Three factors account for the unusual clarity of these images, the nature of the granite bedrock, the single level of building at this short-lived site and the destruction of the city by fire. Burning alters the magnetic properties of certain materials, including mud and some types of stone, in ways that produce stronger anomalies.


Geomagnetic Map of the Büyük Göl Area:

In this image differences in the geology are obvious, but careful examination will show that buildings are visible over the entire area. Streams and the reservoir (Büyük Göl) are superimposed in pale blue. The entire reservoir was surveyed when completely dry at the end of a summer season.
Data management and archiving becomes an important issue with so much collected data. Raw data is filed in a new folder on a daily basis, but the final archive is arranged according to the 300 x 200m areas designated A1, A2 etc, letters running eastward and numbers northwards.


Combined Geophysical and Surface Mapping of the 'Palace Area':

Surface mapping in the field with a Total Station and/or on screen digitising over rectified aerial photos can be combined with geophysical shade plots to provide more comprehensive plans. When test trenches are dug, precise information about the architectural remains can be added. In the 'Palace Area', Test Trench 22 (in red) confirmed the existence of a huge columned hall (in yellow).


The Columned Hall:
A close up of the Columned Hall shows clearly that in some cases interpretation of the geophysical imagery is enhanced by additional information derived from surface observation and, when possible, by test excavation. Ideally geophysical images should be taken back to the field for annotation. This 'ground truthing' or verification increases significantly the accuracy of the final interpretation and drawing up of the planning.


Kerkenes Home Up << Page 4 >> Index