|
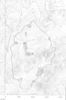
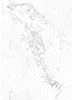
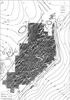
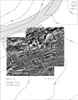
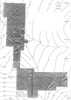
METHODOLOGY The aim is to recover the city plan by methods other than large scale excavations. Balloon photographs from 1993/4 provided the basis. A lOOm x lOOm grid was imposed in 1993 and marked on the ground. Random control points were also marked and surveyed. Levent Topakta~ (METU) downloaded survey data into AutoCAD. A refined grid (Fig. 1) that created manageable areas for photographic and data processing was transposed onto the topographic map, produced from stereo pairs by MNG Inc. (Fig. 1), in AutoCAD. Hans Birk and Henning Schriever from the Bogazkoy Expedition surveyed the grid and established a net of extremely accurate points embedded in rock. Much is gained from taking photographs on to the site during the production of working overlays (Fig. 2) and interpretation. The result is plans of urban sectors (Fig. 3). Because the camera angle was not horizontal there is photographic distortion to correct for. Known points marked on the ground with white powdered lime and/or in some cases the subsequent survey of recognizable features with a total station, allow rectification through AutoCAD or AERIAL. The new version of AERIAL, by John Haig of Bradford University, increases efficiency through the use of a scanner (Fig. 4). Trial geophysical survey in 1993 led to large area magnetometer survey in 1995 (Fig. 1). Although the results (Fig. 5, 7, 10 and 13) speak for themselves, full interpretation necessitates test trenching. Combining geophysical with other forms of data is under active investigation.
|
|