| |
Resistivity
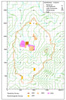
Survey in May 2003
Resistivity
survey was conducted for two weeks in May when the ground was still sufficiently
wet for efficient insertion of the probes. The areas that were surveyed
all lay to the south of the main streambed where it was possible in the
time available to connect and substantially extend the separate areas
previously surveyed (Figs 14,
15,
16,
17,
18,
19,
20,
21,
22,
23,
24,
25).
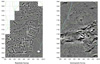
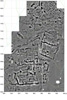
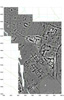
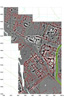
Space
precludes detailed description and discussion of these remarkably clear
and precise images of buried buildings. Three major conclusions can however
be drawn as a result of this survey. Firstly, on the ridge towards the
western side of the city, where magnetometer images had shown that the
fire did not spread very far beyond those special buildings that were
deliberately torched, it could be demonstrated that highly detailed and
clear plans of subsurface structures can be obtained by this method (Fig.
15).
In this region of the city urban blocks that could only be recognised
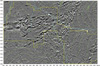
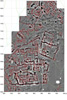
in outline on geomagnetic maps have been fully revealed. Secondly, towards
the northern end of this same ridge a large number of small two-roomed
buildings are seen to have been rather huddled together, although slight
differences in orientation is perhaps suggestive of piecemeal development
(Figs 18
and 19).
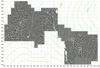
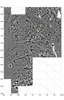
Thirdly, the resistivity images have revealed the existence of many small
structures along the edges of some stream banks (e.g. Fig. 22
at top). Continuation of this survey in future spring seasons will permit
still greater understanding of the urban infrastructure.
|
|