|
|
THE URBAN SURVEY
In the 1999 season the city plan was greatly
extended by non-intrusive remote sensing techniques. Kinematic survey with a Trimble
Global Positioning System (GPS) now covers some eighty percent of the city (Fig. 2). The
resulting topographic map has been generated from a total of 1,286,767 data points of
which 886,377 were collected in 1999. Geomagnetic survey (Fig. 3) with a GEOSCAN FM-36
fluxgate gradiometer continues to be our major research tool at Kerkenes because it
reveals sub-surface features in remarkable detail. The geomagnetic data is collected in 20
x 20m grids that are set out with a SOKKIA total station. Sample density is four reading
per meter at one meter interval. By working 2 shifts per day it has been possible to
survey up to forty grids on a good day. Geo-magnetic images are checked on the ground to
distinguish bedrock and later cultural features from the remains of Iron Age structures.
Geophysical images and balloon photographs can then be draped over the topographic maps
(Fig. 8). A pilot project at METU, in collaboration with Ömür Bakirer, focuses on the
northern end of the city for GIS applications.
Urban Blocks at the Northern End of
the City
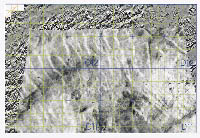
From the extensive geomagnetic map of the northern third of the city, two images that
depict typical urban blocks are presented here. One such block in the lower half of Figure
4a, measures some 60 x 60m and contains several substantial, rectangular structures that
appear to have been heavily burnt. Fainter rectangular features might suggest greater
overburden. The second illustration (Fig. 4b), at a larger scale , shows a block measuring
approximately 40 x 40m with a 20m wide complex adjoining its south-east side. The most
prominent structure, a row of three small square rooms, is a frequent form of building at
Kerkenes.
Public Buildings on the Southern
Ridge
The geomagnetic survey on the southern side of the city was considerably extended (Fig. 3)
and revealed details of several significant structures (Fig. 9b). This area of the site is
of a different character to the lower northern and central area, apparently being chosen
as the location for complexes of public structures.
What we have come to call the "Palace
Complex" now appears to contain a number of independent monumental buildings. These
buildings, seeming to comprise ranges of rooms around courtyards, are not paralleled
elsewhere within the city.
Within the area of the "Polo Field"
and associated Terraces, geophysical survey confirmed the plan drawn in previous seasons.
No evidence was seen that could be interpreted as supporting roofs over the larger
structural units.
|
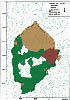
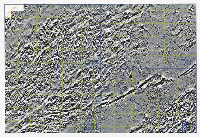
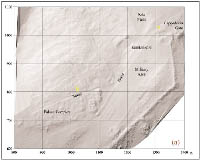
Figure 2
Progress of the GPS survey. Detailed surface mapping now covers some 80% of the city.
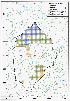
Figure 3
Geomagnetic survey now covers more than one square kilometer, or about 40% of the site.

Figure 4 (a) Geomagnetic image of large urban blocks in the northern
sector of the city. Scale 1:2000.

Figure 4 (b)
Geomagnetic image of an urban block in the north-west sector of the city. Scale 1:1000.
|

|
Figure 5
Geophysical map of the north-west portion of the site. The map is georeferenced with
IRAS/C on the UTM projection with the Kerkenes local grid drawn in Microstation. |
Figure
6
The same area as above with a rectified balloon photo overlay allowing comparison between
on ground and subsurface remains before digitising structures on the geophysical map.
Figures prepared using Intergraph sytems software.
|
Figure 7
Oblique photograph of the northern portion of the city taken from a hot air balloon, in
1993. Areas of Figures 5 and 6 are indicated in red, Figure 8 in yellow. |
Figure
8
2-D geophysical image of the northern portion of the site mapped on the GPS terrain model
to analyse subsurface remains in 3-D. The city wall is shown as a white strip. Inside the
wall, various urban blocks share similar orientation and overlook a small internal valley.
The lower area in the centre contains reservoirs and features connected with water
resource management. |
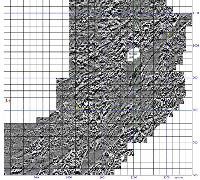
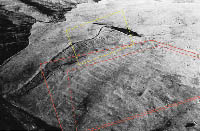
Figure 9 (b)
Geophysical mapping of the southern ridge processed in GEOPLOT and imaged in SURFER. An
important addition to the plan was the clear image of a gate-like entrance building to the
largest terrace (A). This important structure was heavily burnt during the destruction of
the city. The building measures 16 x 16m, and seems to comprise three aisles divided by
two rows of columns. This structure may perhaps represent a freestanding inner gate that
was connected with passage through the nearby external "Cappadocia" (or
South-West) Gate. Across the street from the "Palace Complex", within a
prominent urban block, geomagnetic survey revealed the existence of what would appear to
be a large hall (B) with two rows of columns and a columned anteroom, the whole measuring
15 x 30m.
|