|
THE URBAN SURVEY
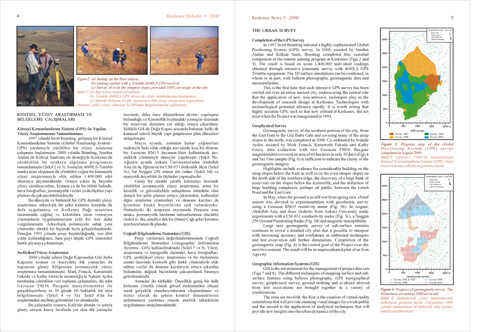
Figure2:
(2a)
Setting up the base station.
(2b)
Getting started with a Trimble 4600LS GPS receiver.
(2c)
Survey of even the steepest slopes provided 100% coverage of the city.
Completion of the GPS
Survey
In 1997 Scott Branting initiated a highly sophisticated Global Positioning
System (GPS) survey. In 2000, assisted by Nurdan Atalan and Köksal
Sanli, Branting completed this essential component of the remote sensing
program at Kerkenes (Figs 1,
2a,
2b,
2c
and 3).
The result is based on some 1,400,000 individual readings obtained through
intensive kinematic survey with 4600LS GPS Trimble equipment. The 3D
surface simulations can be combined, in whole or in part, with balloon
photographs, geomagnetic data and measured plans.
This is the first time that such intensive GPS survey has been carried
out over an entire ancient city, underscoring the central role that
the application of new, non-intrusive, techniques play in the development
of research design at Kerkenes. Technologies with archaeological potential
advance rapidly. It is worth noting that highly accurate GPS, such as
that now utilised at Kerkenes, did not exist when the Project was inaugurated
in 1993.
Geophysical Survey
Geomagnetic survey of the southern portion of the city, from the East
Gate to the Göz Baba Gate and covering many of the steep slopes
to the north, was completed in 2000. Co-ordinated by Nahide Aydin, assisted
by Mark Francis, Katsutoshi Fukuda and Kathy Geers, data collection
with two Geoscan FM36 fluxgate magnetometers covered an area of 60 hectares
in only 30 days (Figs 4
and 5a).
One sample (Fig.
6) is sufficient to indicate the clarity of the geomagnetic imagery.
Highlights include evidence for considerable building on the steep slopes
below the Kale as well as on the even steeper slopes on the north side
of the southern ridge, the discovery of a large bank of reservoirs on
the slopes below the Kiremitlik, and the definition of large building
complexes, perhaps all public, between the Leech Pond and the East Gate.
In May, when the ground was still wet from spring rain, a brief season
was devoted to experimentation with geoelectric survey using a Geoscan
RM15 resistivity meter
(Fig. 5b).
In August, Abdullah Ates and three students from Ankara University made
experiments with a CM-031 conductivity meter (Fig.
5c), a Noggin 250 Ground Penetrating Radar (Fig.
5d) and magnetic susceptibility.
Large area geomagnetic survey of sub-surface remains continues to reveal
a detailed city plan that it possible to interpret with increasing accuracy
and confidence as additional techniques and test excavation add further
dimensions. Completion of the geomagnetic map (Fig.
4) is the central goal of the Project over the next two seasons.
The result will be an unprecedented plan of an Iron Age city.
Geographic Information Systems (GIS)
GIS is the environment for the management of project data sets (Figs
7 and 8).
The different techniques of mapping surface and sub- surface features
using balloon photography, GPS topographical survey, geophysical survey,
ground truthing and evidence derived from test excavations are brought
together in a variety of combinations.
The aims are twofold: the first is the creation of virtual reality simulations
that will provide stunning visual images for a wide public and the second
is the application of analytical techniques that will provide new insights
into the urban dynamics of the city.
Figure
3: Progress map of the Global Positioning System (GPS) survey completed
in August 2000.
Figure 4: Progress
of geomagnetic survey. The 60 hectares covered in 2000 are in red. |