Cover

Page 2 - 3

Page 4 - 5

Page 6 - 7

Page 8 - 9

Page 10 - 11

Page 12 - 13

Page 14 - 15


Figure 5:
(5a) Geophysical survey using a Geoscan FM36 fluxgate gradiometer,
(5b) a Geoscan RM15 resistivity meter,
(5c) a CM-031 conductivity meter,
(5d) and a Noggin 250 ground penetrating radar.

Figure 
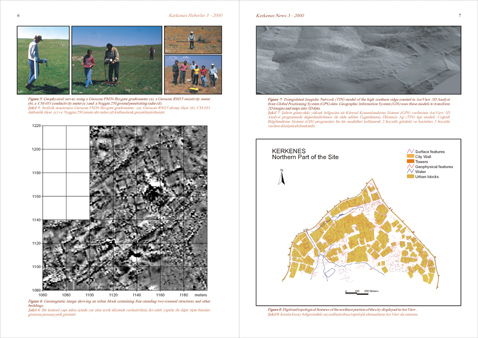
6: Geomagnetic image showing an urban block containing free-standing two-roomed structures and other buildings.

Figure 7: Triangulated Irregular Network (TIN) model of the high southern ridge created in ArcView 3D Analyst from Global Positioning System (GPS) data. Geographic Information System (GIS) uses these models to transform 2D images and maps into 3D data.

Figure 8: Digitised topological features of the northern portion of the city displayed in ArcView .

Figure 6 Figure 8 Figure 5a Figure 5b Figure 5c Figure 5d Figure 7